
Analytics: automation
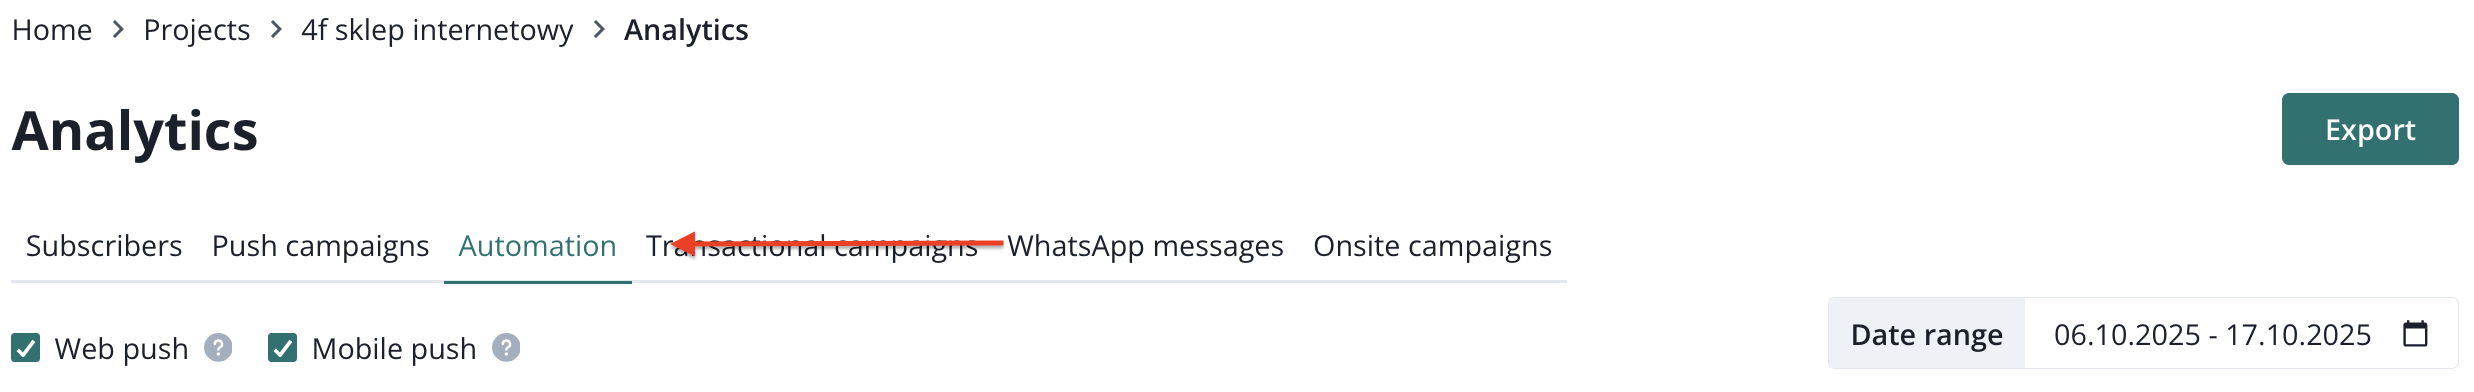
To find automation analytics page, you must switch to the correct tab while you are in analytics.
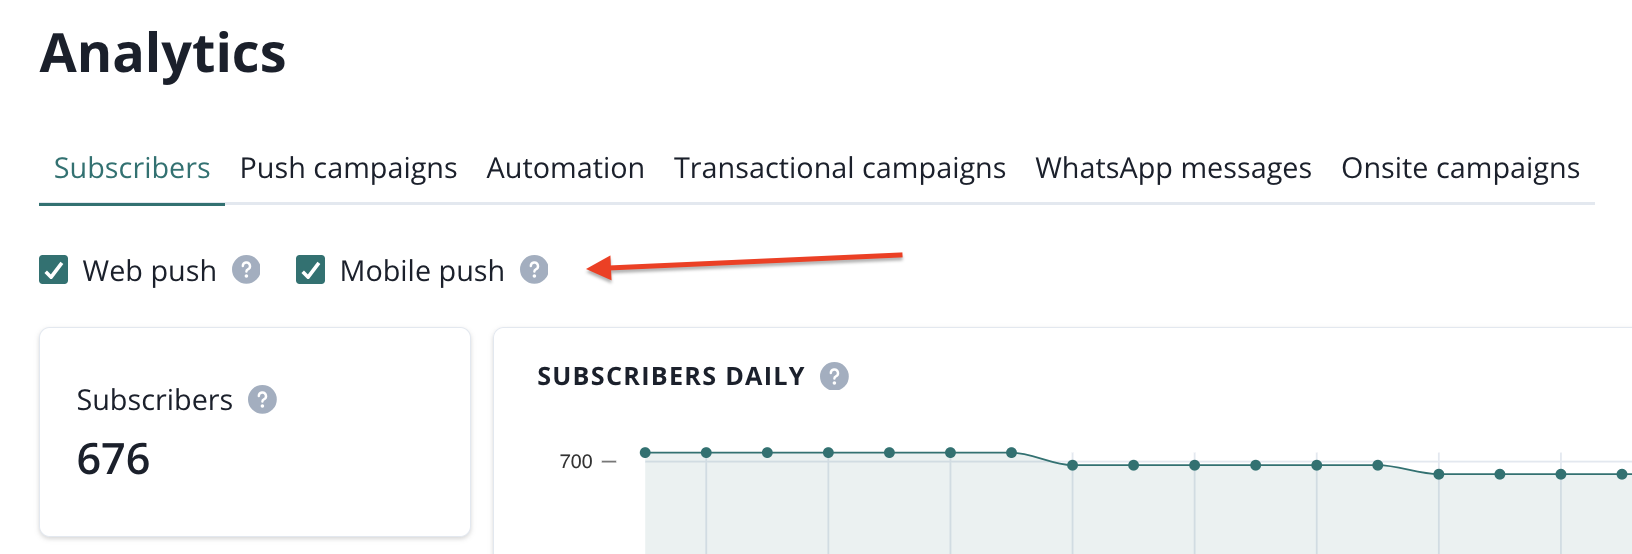
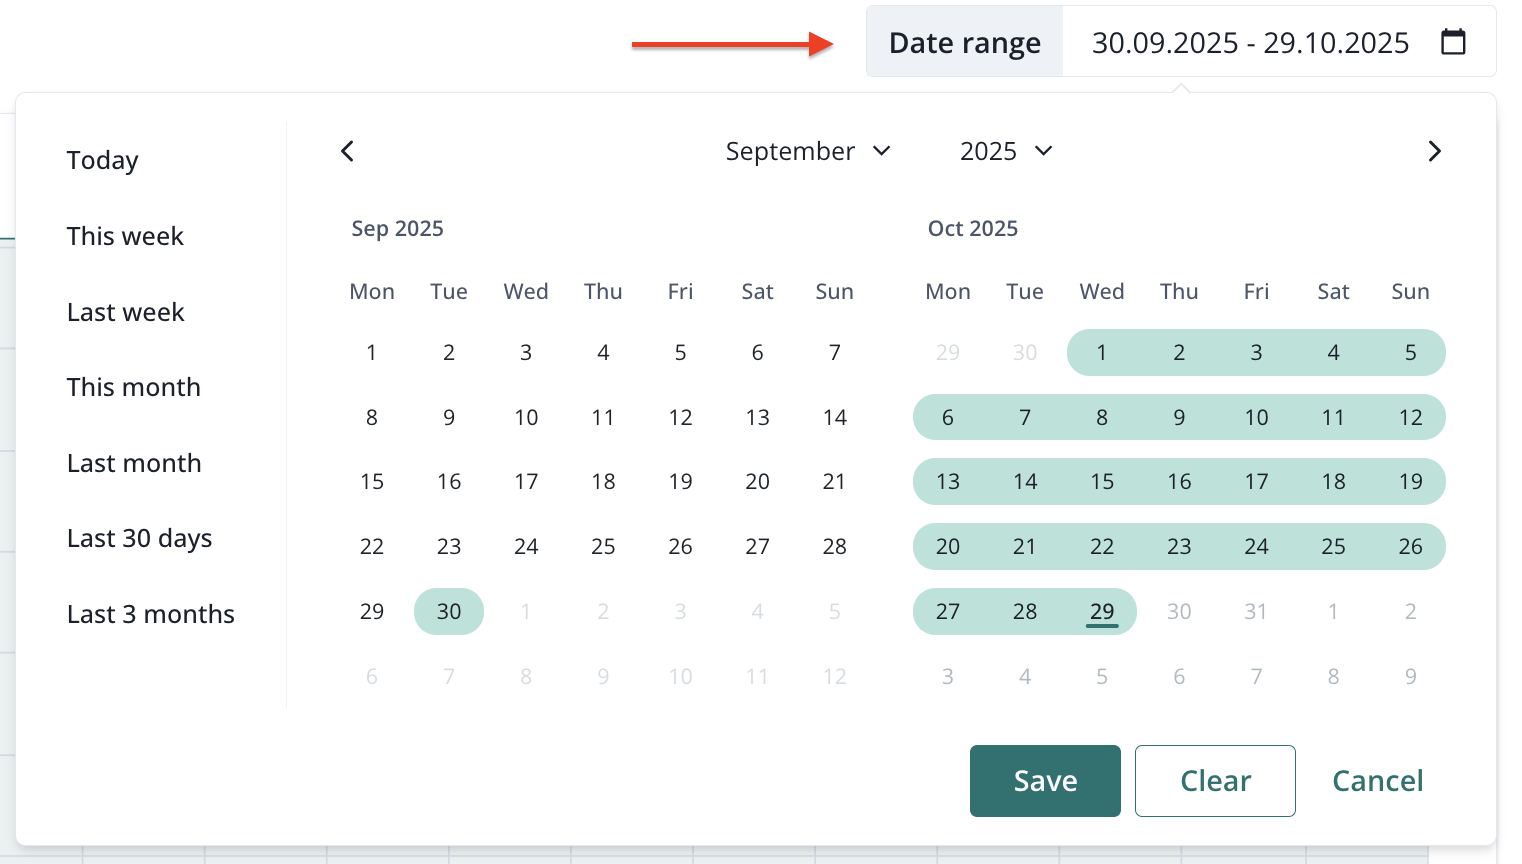
You can filter the results by web and mobile push and the date range (maximum past 90 days).
Right below these filters you will find a set of important metrics regarding your automations. The automation results chart can be filtered by the metric (CTR, DSP, Delivered & Clicked):
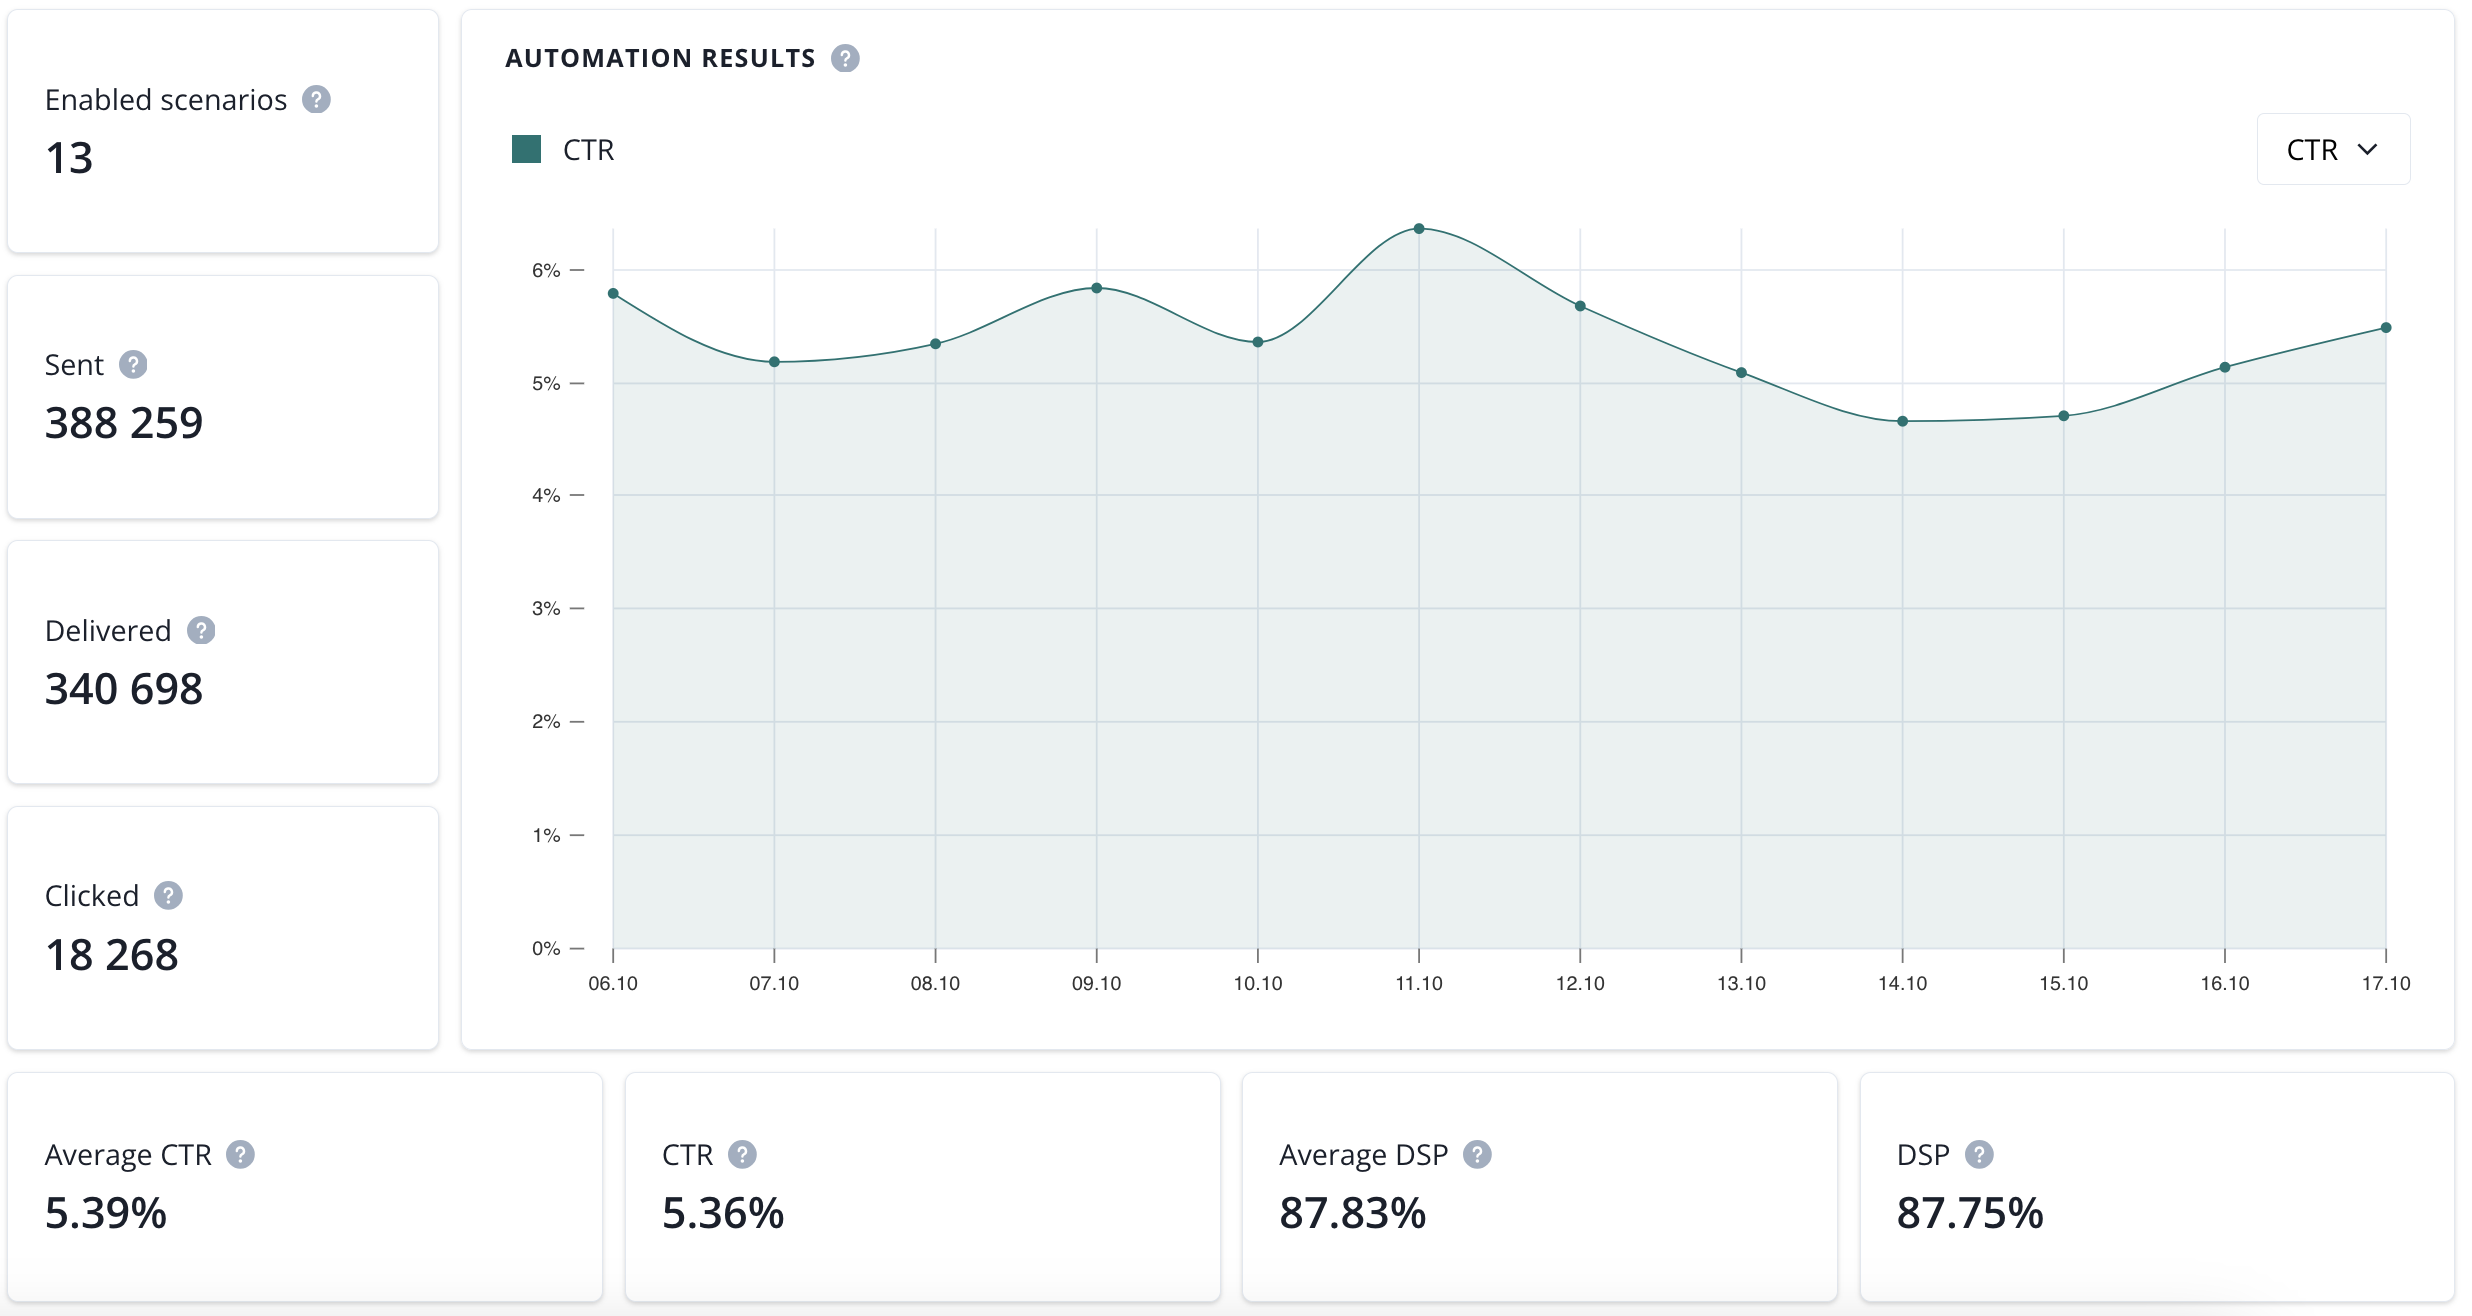
- enabled scenarios (number of automation scenarios with push casmpaigns that are currently enabled),
- sent (number of sent notifications in a selected date range),
- delivered (number of delivered notifications in a selected date range),
- clicked (number of clicked notifications in a selected date range),
- average CTR (average click-through rate in a selected time range),
- CTR (click-through rate in a selected time range),
- average DSP (average deliverability rate in a selected time range).
- DSP (deliverability rate in a selected time range).
The final section consist of Average automation CTR and DSP and automation rank:
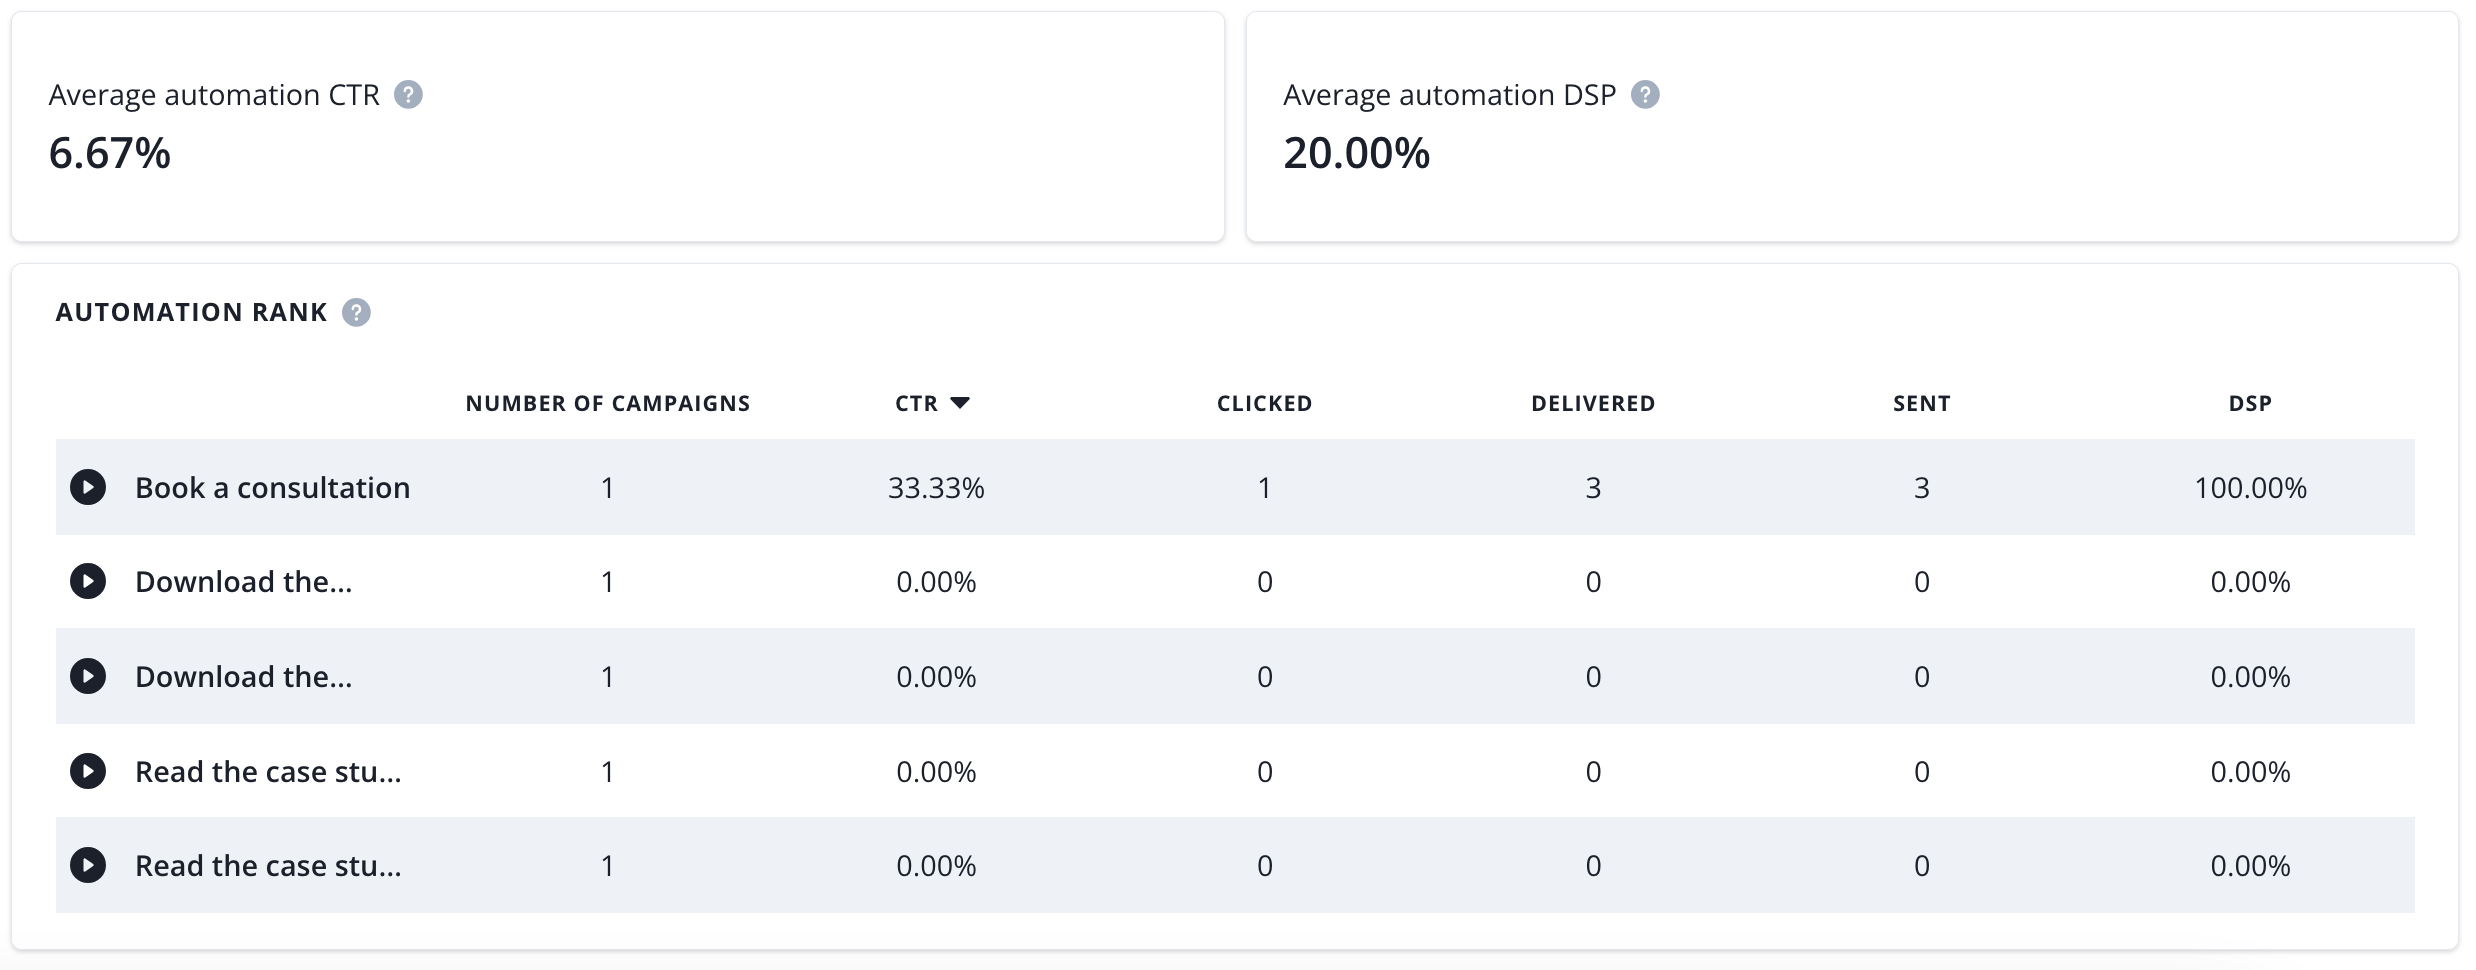
- average automation CTR (average click-through rate of automation scenarios in a selected time range),
- average campaign DSP (average deliverability rate of autmations scenarios in a selected time range),
- campaign rank (list of automations with push campaigns sent in a selected time range with statistics).