Analytics: subscribers
The first page in analytics is dedicatied to your push subscribers.
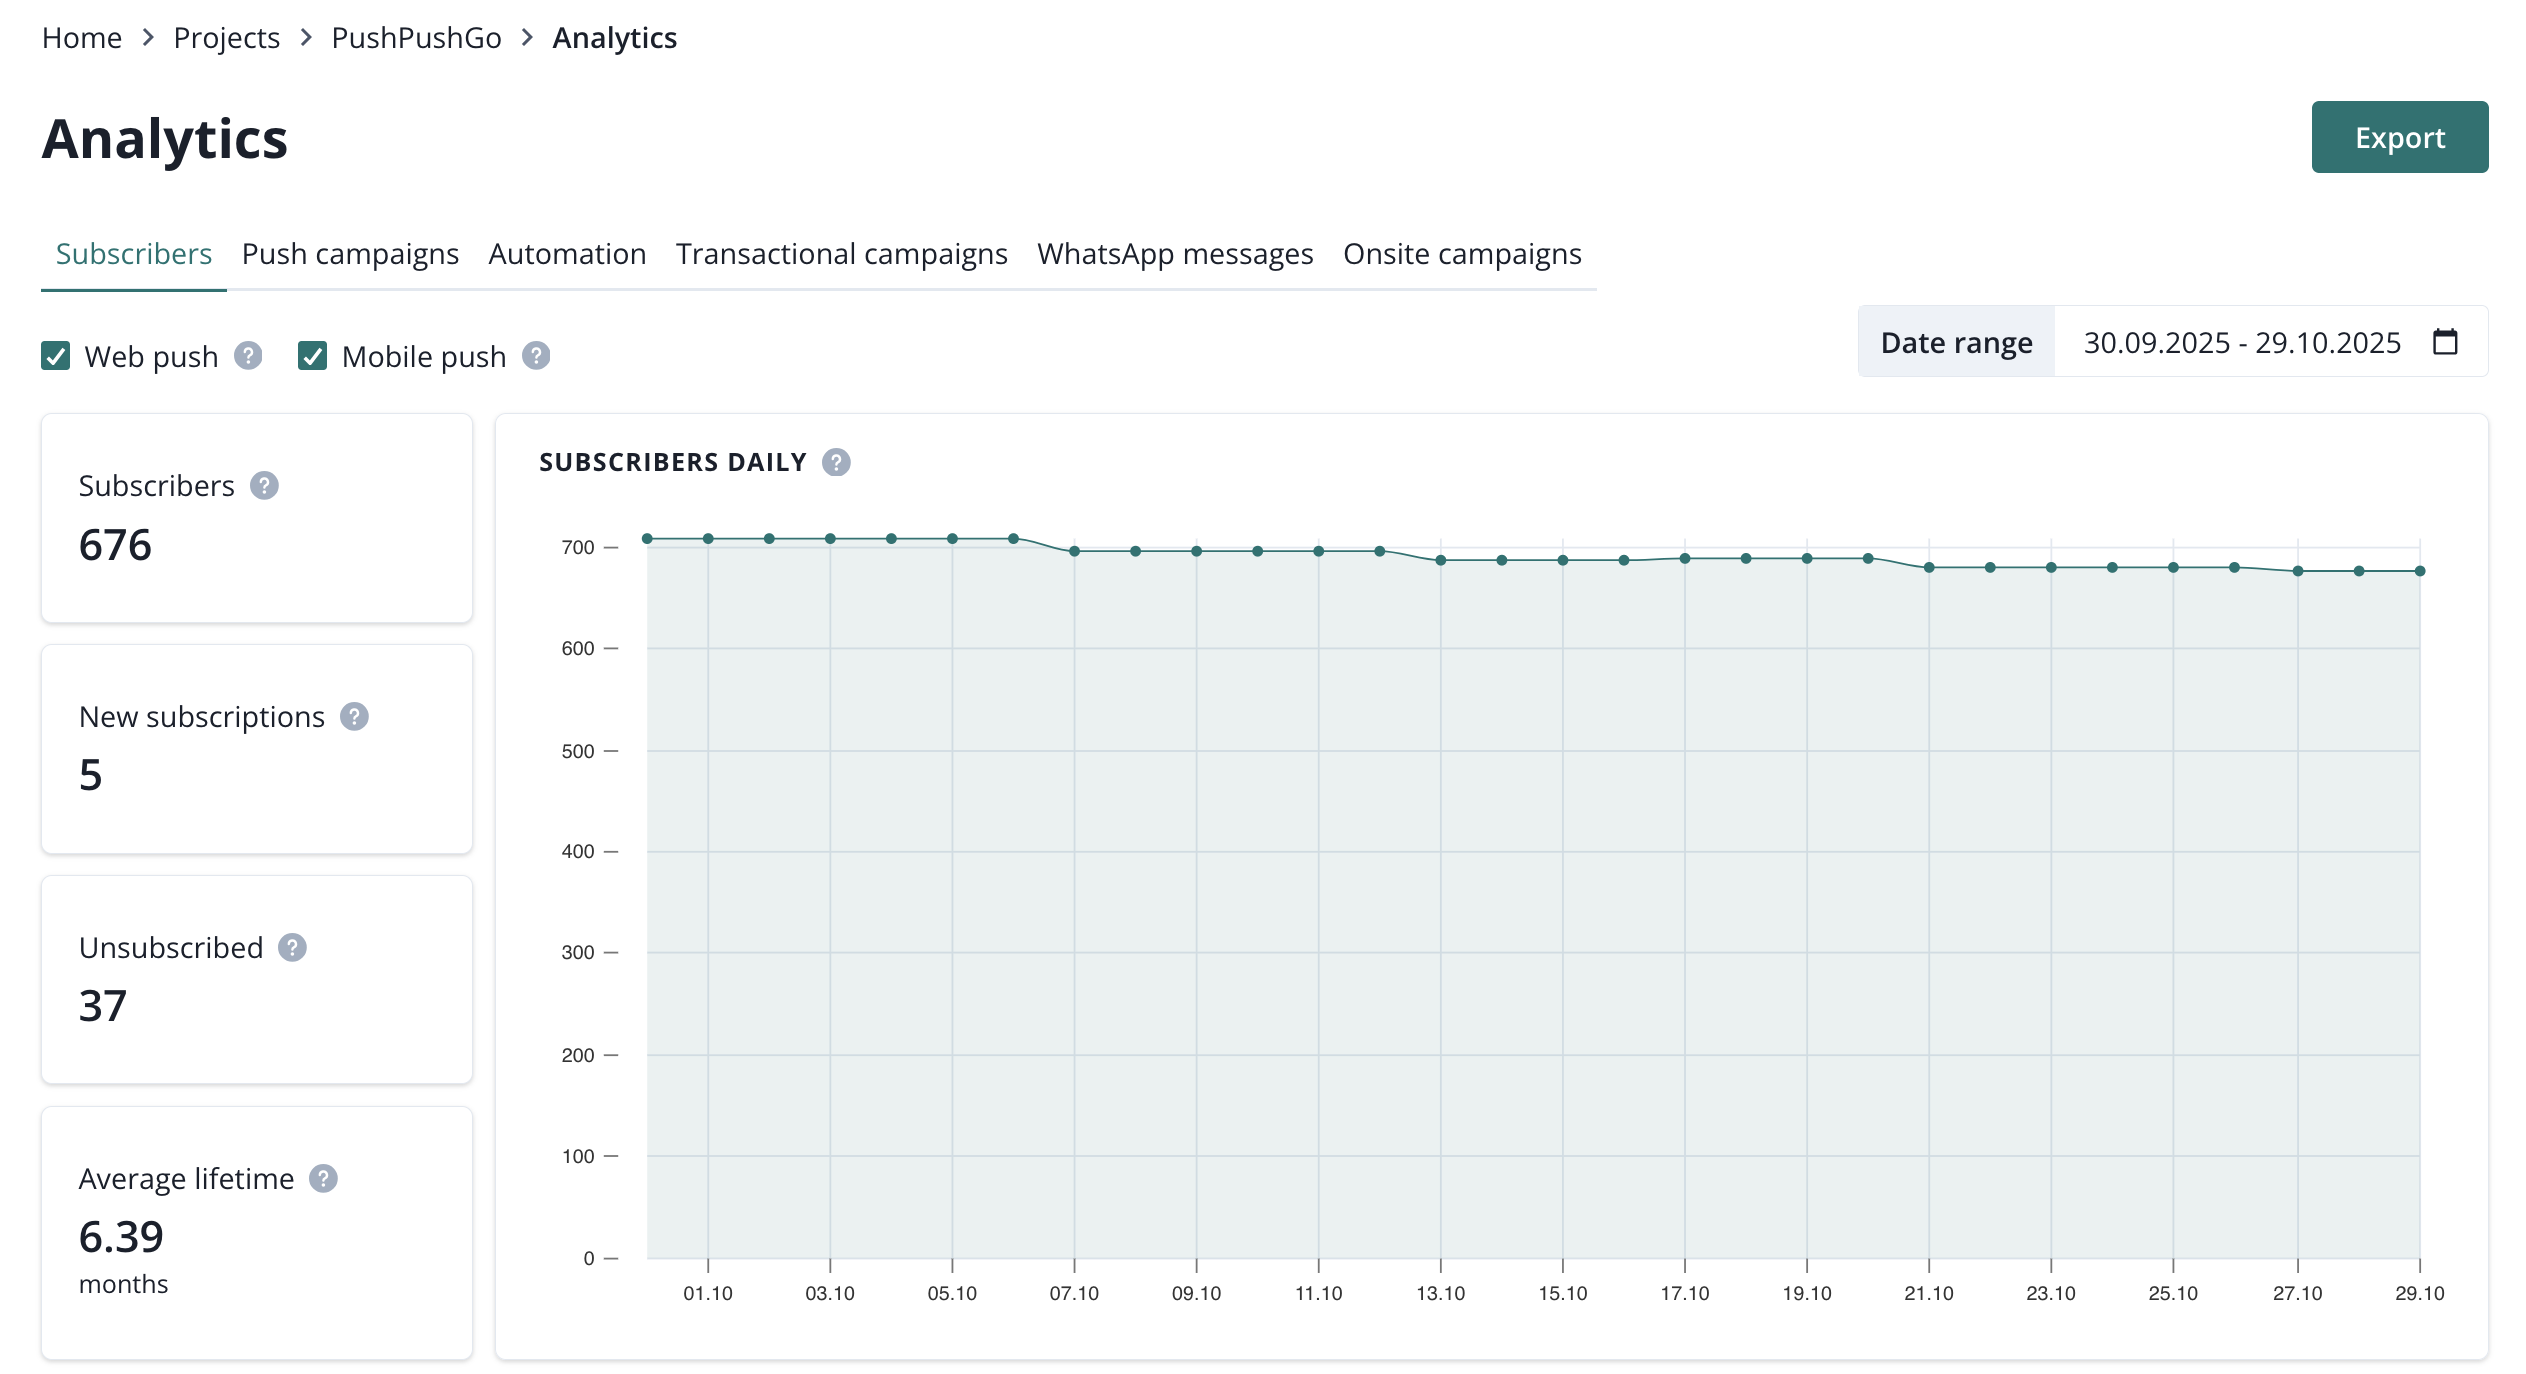
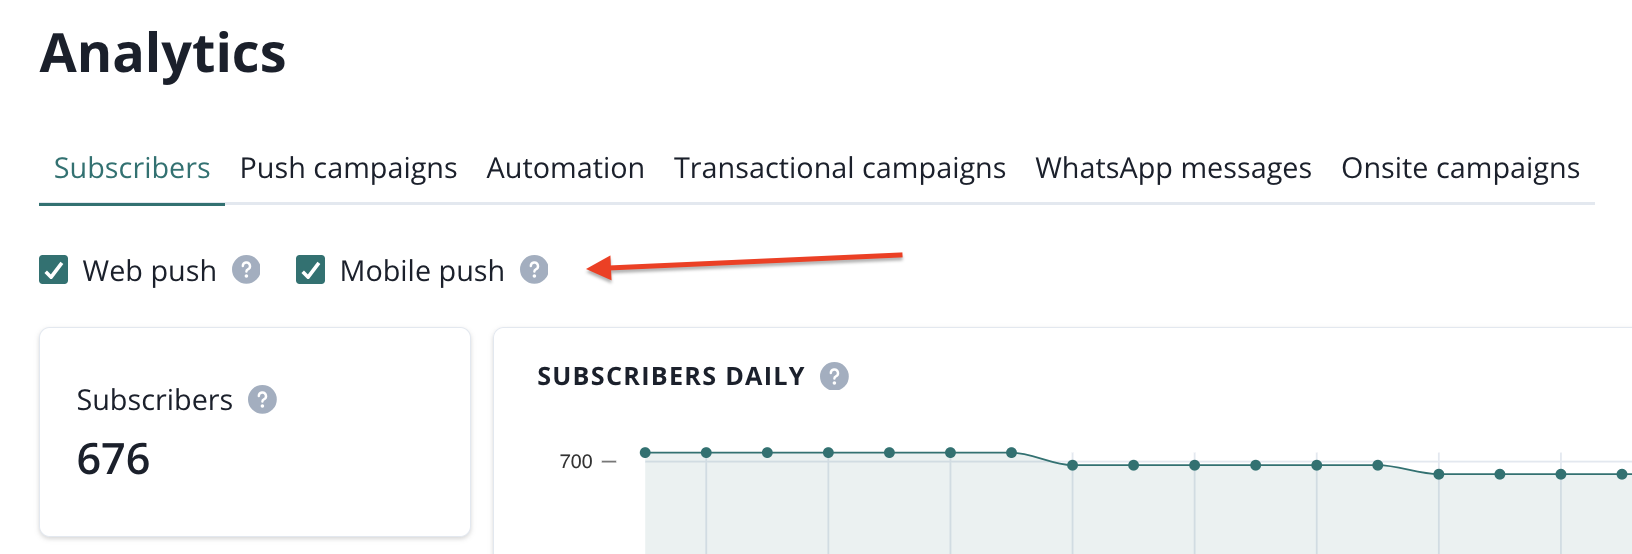
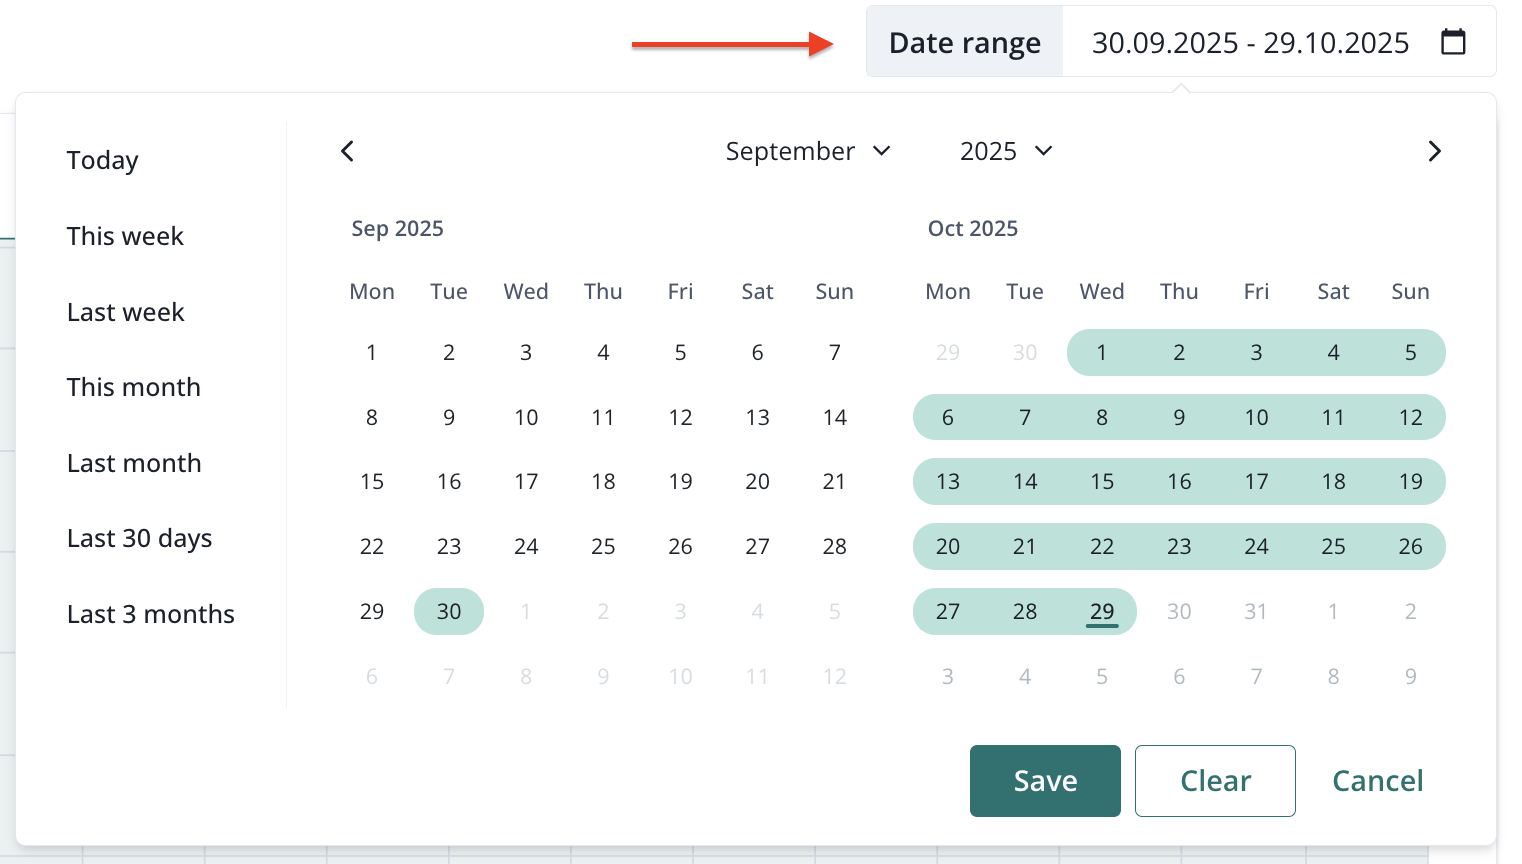
You can filter the results by web and mobile push and the date range (maximum past 90 days).
Right below these filters you will find a set of important metrics regarding your subscribers.
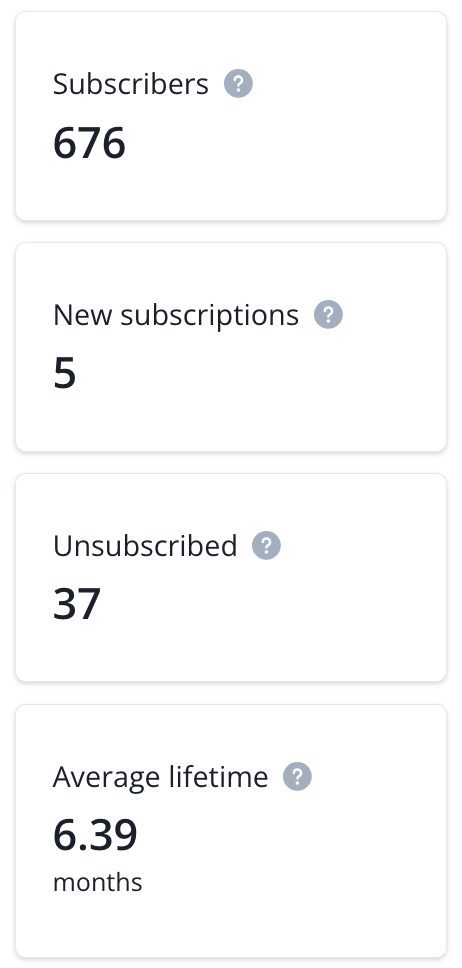
- Subscribers (overall number of users who are currently subscribed to push notifications, estimated daily).
- New subscriptions (number of subscribers who agreed to receive notifications in a selected time range).
- Unsubscribed (number of users who unsubscribed from notifications or that were expired, unregistered or inactivated in a selected date range).
- Average lifetime (time from start to end of subscription, based on the last 12 months).
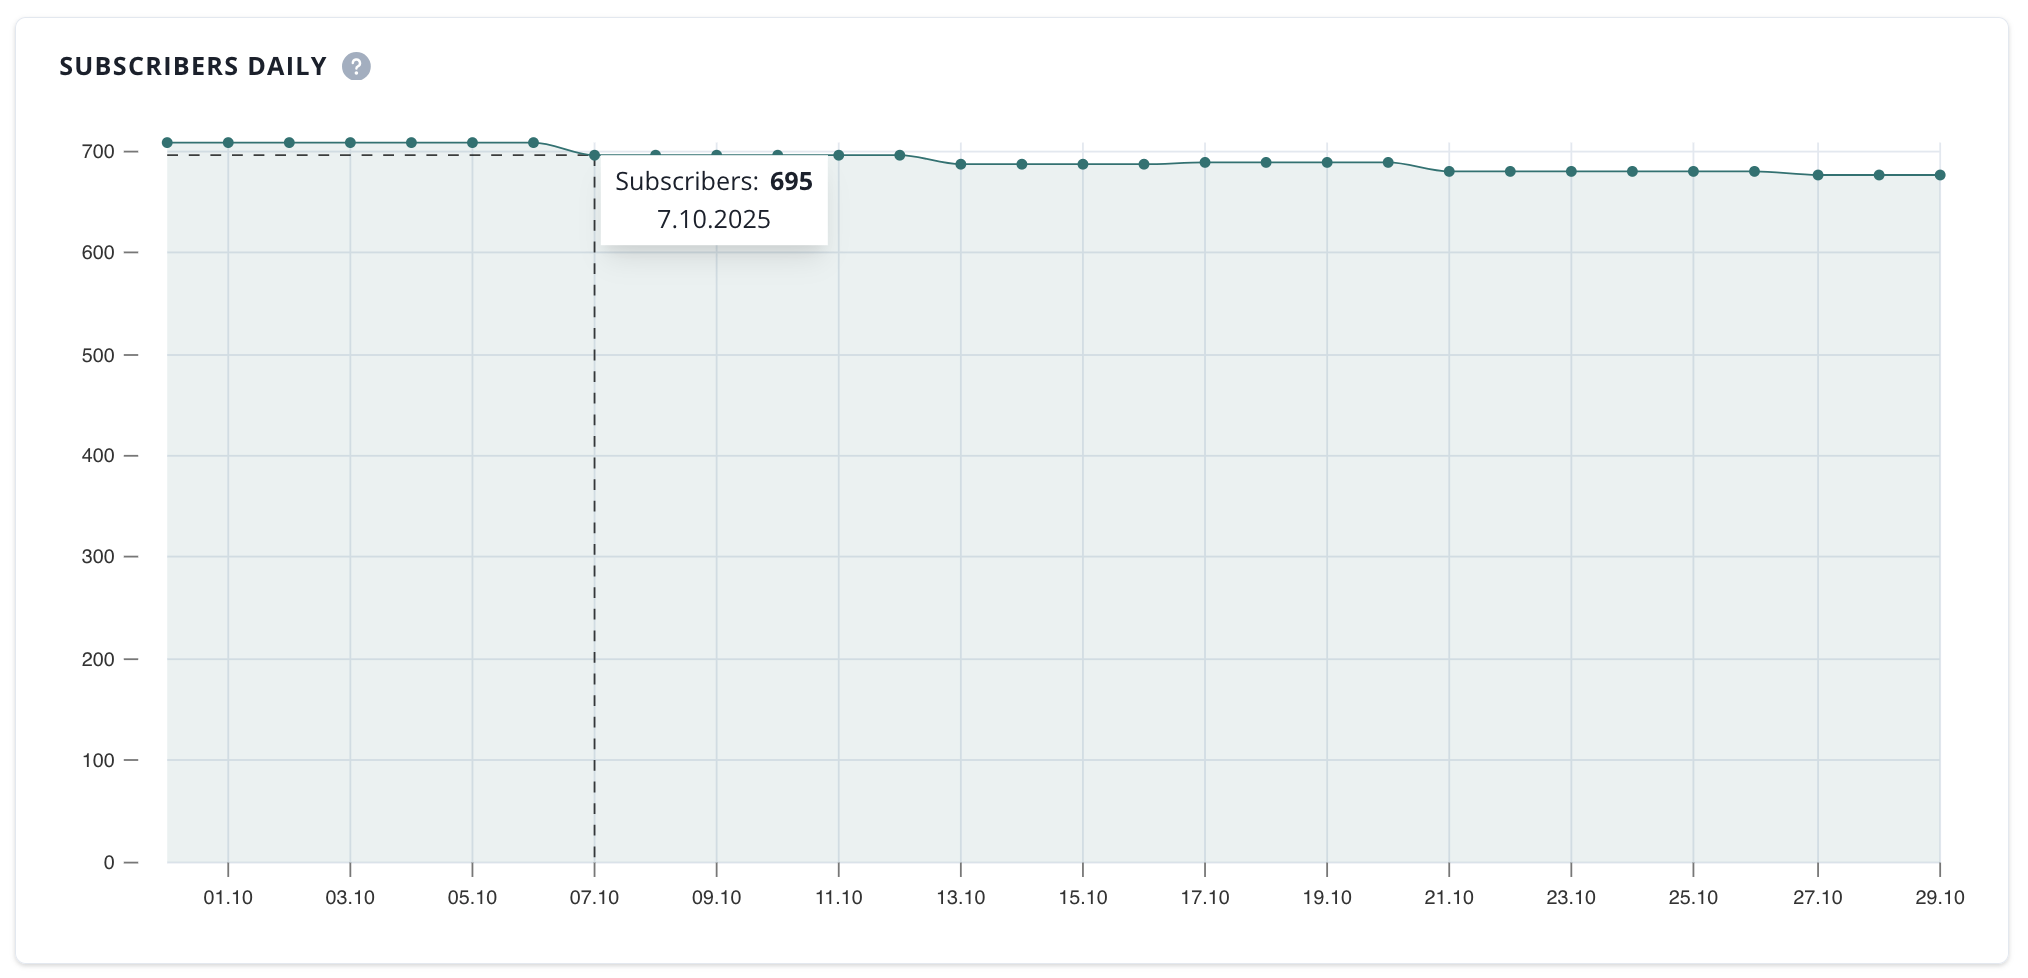
In addition to the metrics above, there is a chart showing total subscriptions.
Next, we have subscriptions daily and subscriber lifetime charts
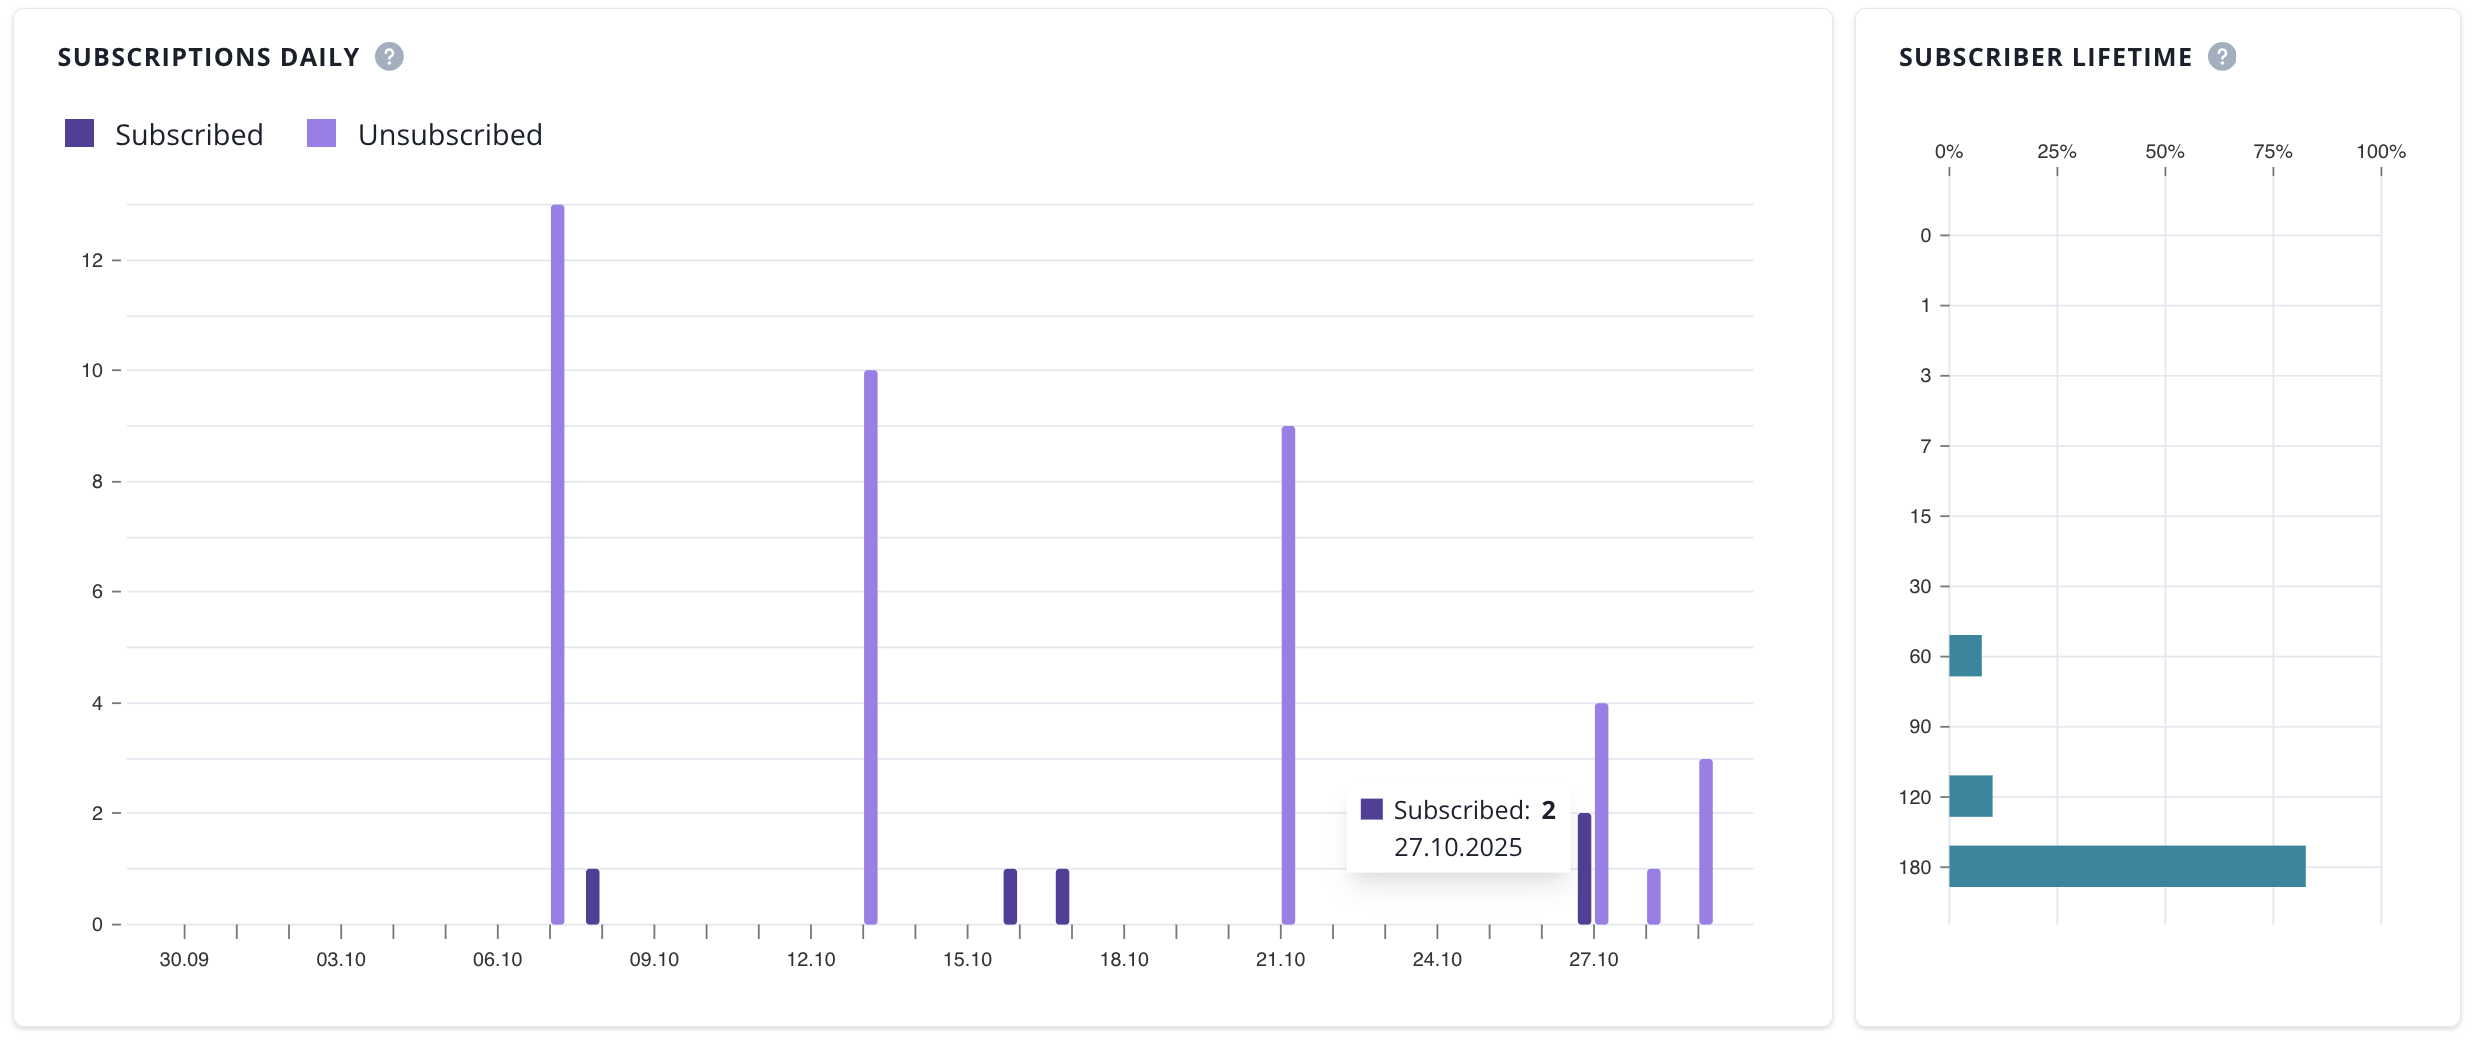
- Subscriptions daily (daily number of new subscriptions and unsubscribed in a selected date range)
- Subscriber lifetime (lifetime distribution of subscribers who were unsubscribed in a selected time range)
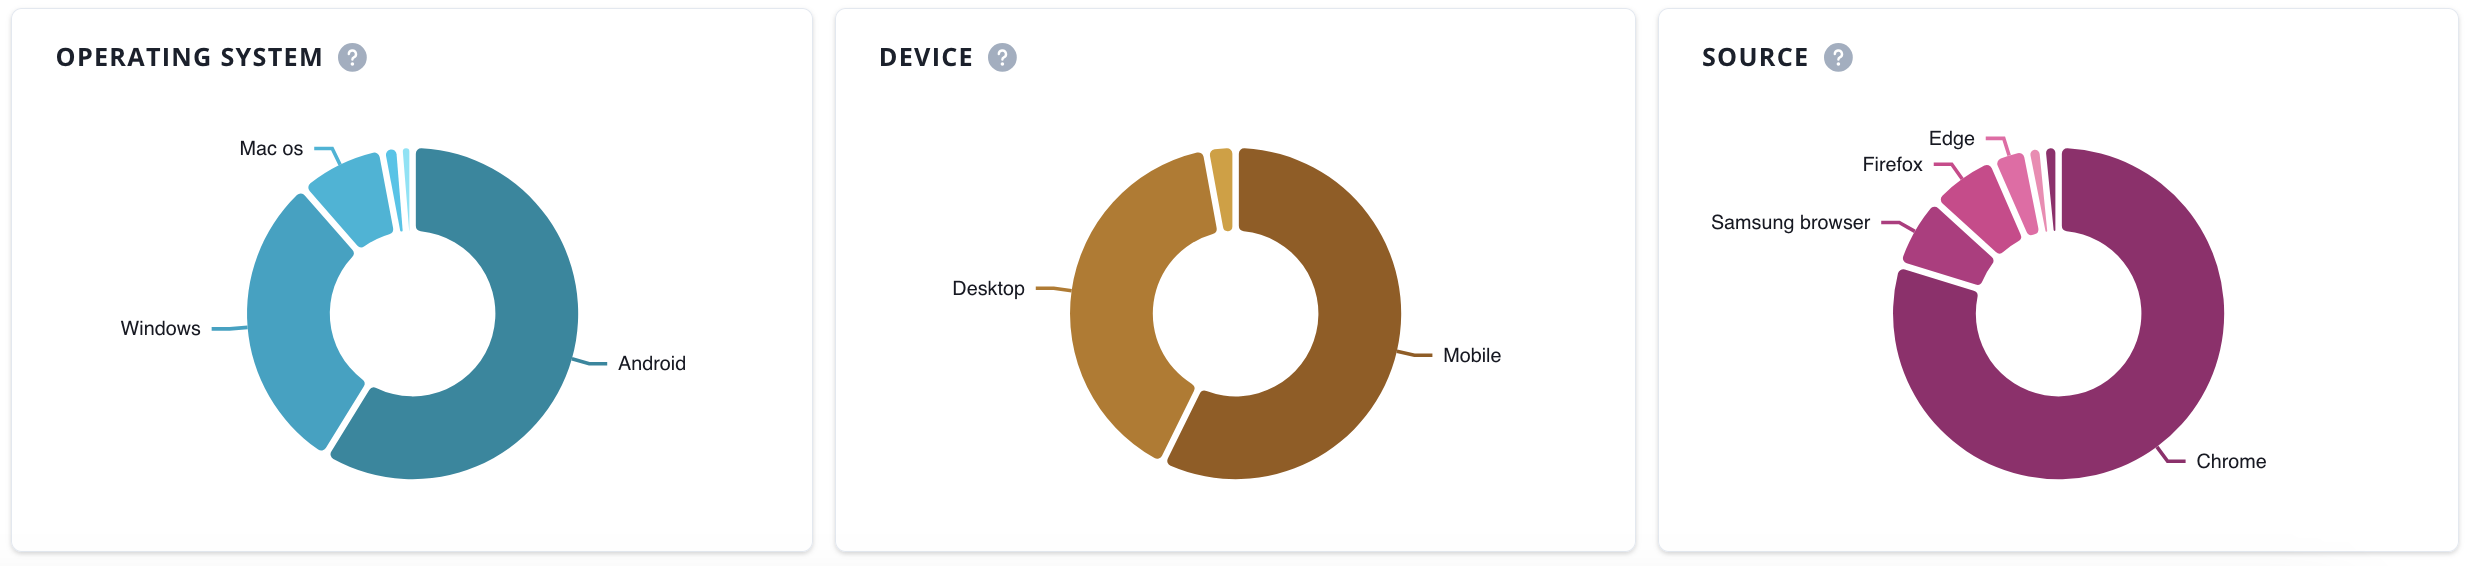
The final section of the subscribers analytics page includes doughnut charts that show the distribution of operating systems, devices, and sources among your push subscribers.